COGS9 Note
1. Intro to data science
1. Definition of data science
- Data science != machine learning
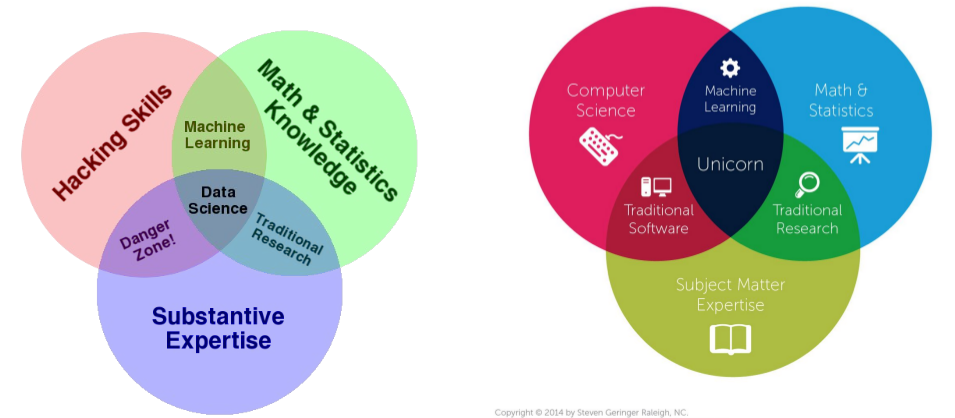
- Def: The scientific process of extracting value from data
2. What do data scientists do
Data scientists ask interesting questions & answer them with data
3. Questions
- What questions should I ask on a first date?
- Studying coordinated migration
- How do I improve ride sharing?
4. About this course
- This is a ‘survey’ course.
- Topics:
- Data Science & Ethics
- Version Control & Programming
- Data & Data Wrangling
- Data Visualization & Communication
- Approaches to Data Analysis
- Exams:
- Mon Oct 21st - “What is Data Science” through “Data Wrangling”
- Mon Dec 2nd - “Data Visualization” through Guest Lectures
2. Ethics
1. About Reading1
- What points were made that you had not previously considered?
- What points do you agree with? With which do you disagree?
- What do you not understand? (Ask questions about these in section!)
- What points/topics do you think are missing?
- Does anything differ with what you’ve learned in other classes? Other papers/books?
- What ideas did this reading give you? What do you want to go learn more about?
3. Data science questions
1. Data science process
- ask an instreresting question
- get the data
- explore the data
- model the data
- communicate and visualize the results
2. Question
- Be specific
- Be answerable with data
- Specify what’s being measured
4. Reproducibility
1. Definition of reproducibility
Re-performing the same analysis (with the same code) using a different analyst
2. Why haven’t we always been reproducible?
- Data science education and effective communication can improve these!
- Lack of statistical literacy
- Lack of computational literacy
- These can largely be addressed with fairly simple changes!
- Failure to publish code
- Lack of mechanism for peer-reviewing code
- Lack of transparency in review of papers
- Others
- Lack of incentive / funds
3. Definition of Replicable
Re-performing the experiment and collecting new data
Replicability is harder than reproducibility(Because the data is different & data is variable)
Defin: The measurement can be obtained with stated precision by a different team using the same measurement procedure, the same measuring system, under the same operating conditions, in the same or a different location on multiple trials.
4. Why would a study fail to replicate?
- Finding was not “real” (or small effect)
- Measurement error
- Variable finding (i.e. time)
- Different population
- Different experimental design or conditions
5. Confirmation Bias
A cognitive bias wherein humans have a tendency to search for, interpret, favor, and recall information in a way that confirms one’s preexisting beliefs or hypotheses.
5. Programming
1. workflow => Think-Try-Read
- Think about what it is you want to do.
- Try it out.
- If you succeed, awesome.
- If not, continue on…
- Read to try to figure out the answer (Google/Stack Overflow/books/your friend/etc.).
- Wash, Rinse, Repeat.
6. File management
1. Version Control
A way to manage the evolution of a set of files
- Enables multiple people to simultaneously work on a single project.
- Each person edits their own copy of the files and chooses when to share those changes with the rest of the team.
- Thus, temporary or partial edits by one person do not interfere with another person’s work
2. File name
- Machine readable
- Human readable
- Nicely ordered
7. Data
1. Variable Types
- Quantitative
- Integers (whole numbers, i.e. 10)
- Continuous: Float or Numeric (200.78)
- Qualitative
- String or Character (“Hello World”)
- Categorical or Discrete (limited number of options) - (i.e. minor, adult)
2. categorize data storage
- Semi-structured*
- spreadsheets (tabular data)
- JSON & XML
- Structured
- relational databases (SQL)
- Unstructured
- everything else: video, audio, images, websites, apps, text, etc.
Data Scientists work with semi-structured data most frequently, but have to familiar with and comfortable in all types
8. Getting data
1. Where
- All in nice spreadsheet
- Open data
- www.kaggle.com
- data.world …
- Open data
- Not in nice spreadsheet
- HTTP(If there’s API)
- WEB SCRAPING(If there’s not API)
Use API Accessing an API
- Choose Method
- Build URL
- Get Authorization
9. Data wrangling
1. Tidy Data Benefits
- consistent data structure
- foster tool development
- require only a small set of tools to be learned
- allow for datasets to be combined
2. steps
- Step 1: Join columns from separate tables by ID
- Step 2: Select columns from separate tables you want included in your output
- Step 3: Arrange rows to order by series and then by episode
- Step 4: Mutate & Summarize to add columns
10. Data visualization
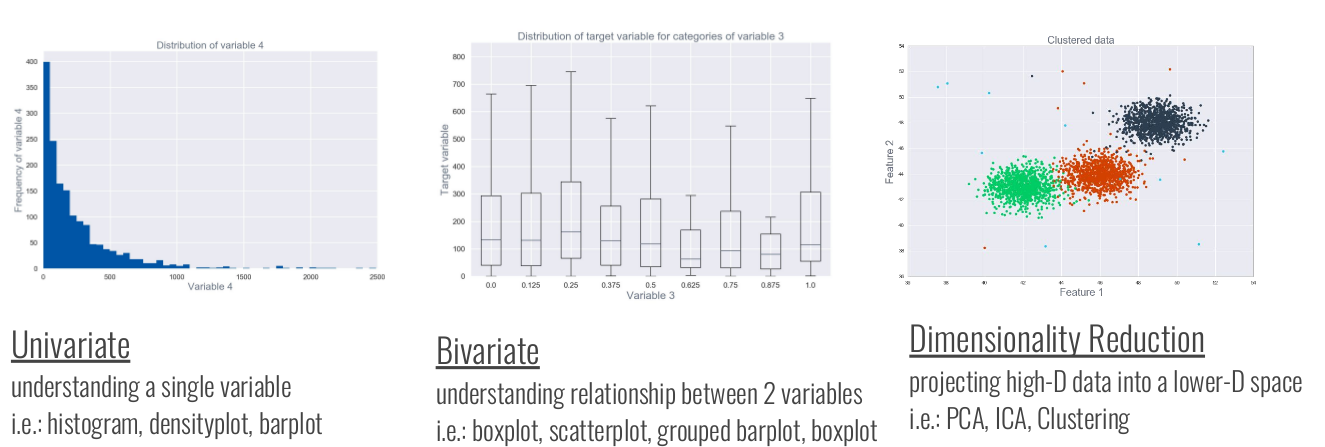
1. Information about a single set of numbers
- Histograms: Range of possible height values is easily visualized
- Densityplot: Demonstrates the distribution of the data (A smoothed version of a histogram)
2. Relationship between two numerical variables
- Scatteplot
3. Count of values within a categorical variable
- Barplot: Can easily see that there are more females than males
4. Summary of numerical values across categories
- Boxplot: The middle line represents the median & tells you the typical height for females and males
5. Effective ways to display data summaries
- Table: Tables count as data visualizations!
11. Descriptive Data Analysis
1. Descriptive:
The goal of descriptive analysis is to understand the components of a data set, describe what they are, and explain that description to others who might want to understand the data.
2. sampling & statistics
- Statistics: the science that deals with the collection, classification, analysis, and interpretation of numerical facts or data, and that, by use of mathematical theories of probability, imposes order and regularity on aggregates of more or less disparate elements.
- sampling: need to be random and no-bias
3. How to describe a dataset
- Shape: It’s critical to know the distribution of the variables in your dataset because certain statistical approaches can only be used with certain distributions.
- Size
- Central Tendency
- Missingness: It’s critical to know how many observations have missing data for variables of interest in your data.
- Variability
4. Outlier
- Data entry errors
- Poor sampling procedures
- Technical or mechanical error
- Unexpected changes in weather
- People providing inaccurate information
Caution: Observations should only be removed from your dataset if you have a valid reason to do so.
5. mean, median, and/or mode
The mode is the most frequently observed category
- Range: highest score - lowest score
- Interquartile Range (IQR): 75th percentile - 25th percentile
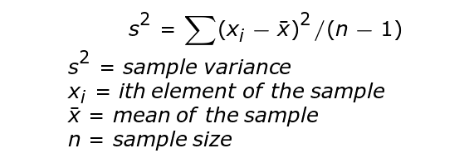
- variance: measures how close the values in the distribution are to the middle of the distribution - average squared difference of the scores from the mean
- standard deviation (SD): square-root of the variance
12 EDA(Exploratory Data Analysis)
Answers the question “What can the data tell us?”
1. EDA Approaches to “Get a Feel for the Data”
2. When NOT to do EDA
- To identify samples that you can remove from your study after you’ve already analyzed the data
- After running a statistical test and seeing that your p-value is 0.054
- After completing an analysis and getting an answer you don’t like
- To improve the correlation between two variables
13 Data visualization(Visualization for Communication)
1. why data communication matters
- it’s often the only thing your boss see
- it can set your work from others
- it helps show off the awesome stuff you have done
- cognitive load is a thing
2. Exploratory vs. Explanatory
Creating good visualization is a process
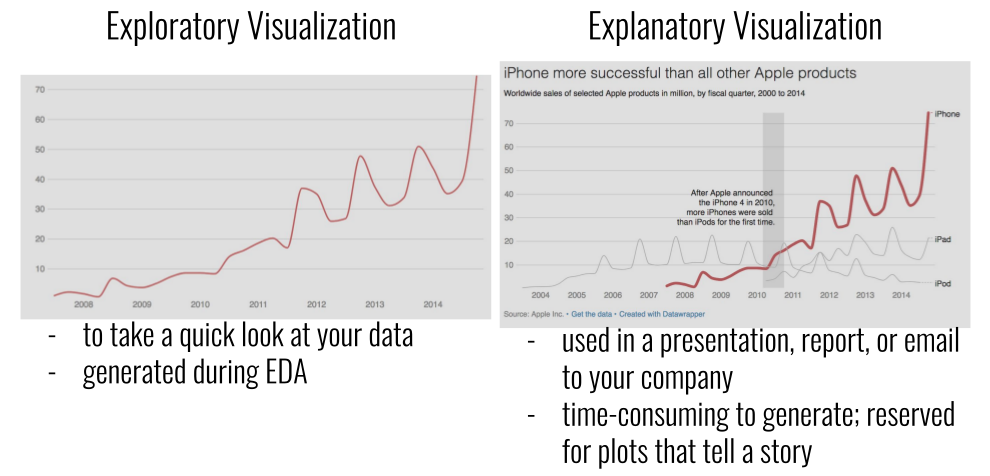
3. Creating visuals for communication(aka explanation data visualizations)
- What’s your point?
headline - How can you emphasize yout point in your chart
chart type, data, color, highlights, annotations - What does the final chart show exactly
description, legends/keys, source
4. COloe consideration
- Gradients are for continuous values. Distinct colors are for categories
- Color consistency helps viewers.
- Gray is your friend.
- Choose intuitive colors
5. less is more (Effective Visualization For Communication)
Your communication should tell a story
- A beginning
- provide context
- tell your audience what you’re going to tell them
- A middle
- show them
- tell them
- An end
Repetition is ok. You may be familiar with your topic, but your audience is not
6. Presentation
- when presentation out loud
- don’t read directly off the slides
- use animation to build your story
- you benefit from having words to explain out loud what you’re showing
- when presentation on paper
- you can put more on a single visualization
- you benefit from people having time to look at what you’ve sent
14 Analytical Approaches
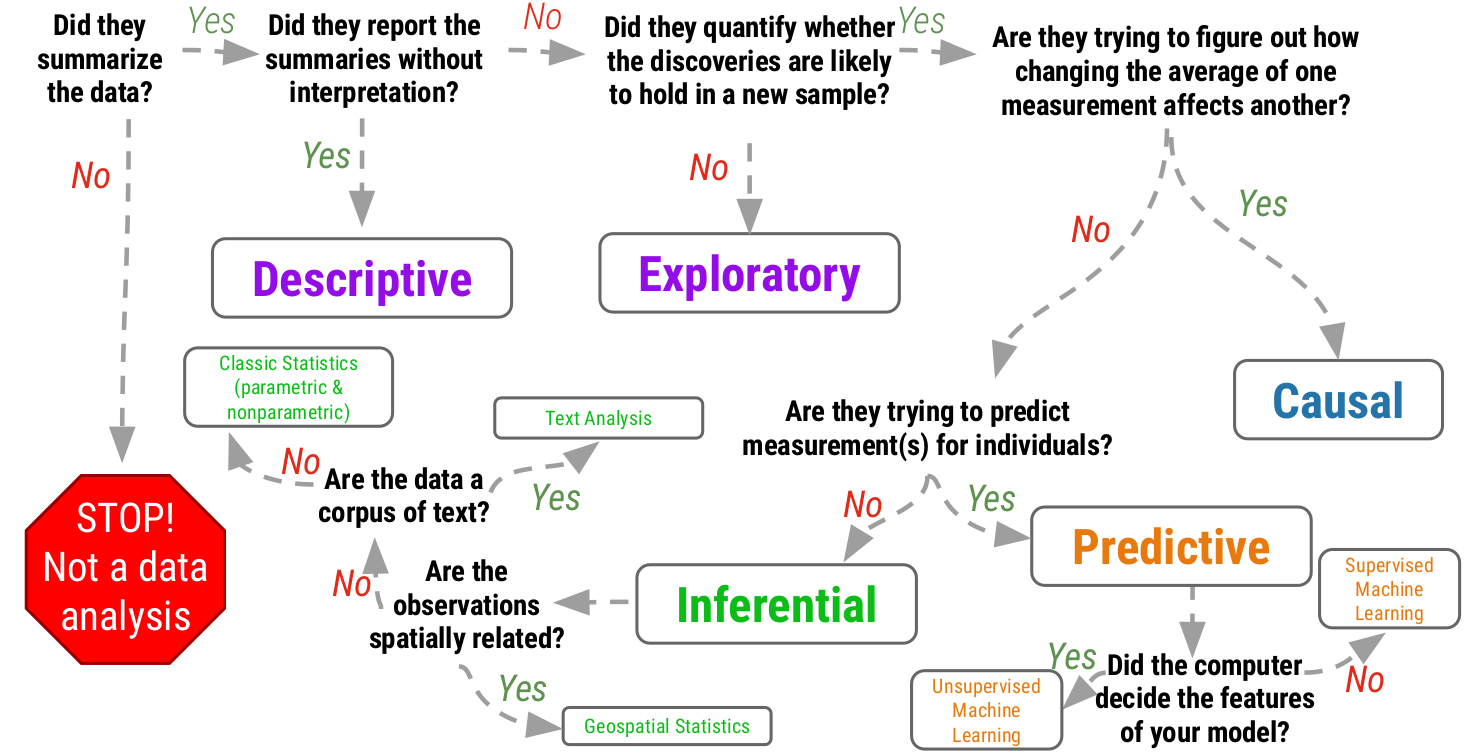
15 Inferential Analysis
1. approaches of inference
-
correltation: ASSOCIATION BETWEEN VARIABLES
Pearson’s r: linear correlation between two variables (takes values [-1,1])
Correlation establishes a relationship. It does NOT establish causation. - comparison of means: DIFFERENCE IN MEANS BETWEEN VARIABLES
t-test:tests for difference in means between groups.
t-test Assumptions- Data are continuous
- Normally distributed
- Large enough sample size
- Equal variance b/w groups
p-value : the probability of getting the observed results (or results more extreme) by chance alone
- regression: DOES CHANGE IN ONE VARIABLE MEAN CHANGE IN ANOTHER?
- Effect size (β) can be estimated using the slope of the line
- non-paramatric tests: FOR WHEN ASSUMPTIONS IN THESE OTHER 3 CATEGORIES ARE NOT MET
2. Confounding
Ignoring confounders will lead you to draw incorrect conclusions from your analyses
You can plan ahead to avoid confounding and/or include confounders in your models to account for their role on the outcome variable.
16. A/B testing
- A/B Testing : Designing and running an experiment to compare two versions (typically, a web page or an app), to determine which is “better”
- Guidline for A/B:
- Choose one key metric for testing
- Design Experiment & Run for Length of Time Planned
- Confidence Intervals more important than p-values
- Don’t look at all the possible subgroups
- Look for “bucketing skew”
- Only include meaningful users in your sample
- Keep the analytical approach simple
- Change one thing at a time
17. machine learning I
- predictive analysis uses data you have now to make predictions in the future
- machine learning approaches are used for predictive analysis!
1. Machine Learning Generalizations
- Basic Steps to Prediction
- data partitioning
- feature selection
- model selection
- model assessment
18. machine learning II
- unsupervise learning
- deep learning
19. Algorithms & Computability
- definition of algorithm: A finite set of rules that, if followed precisely, defines a sequence of operations that solves the problem in a finite number of steps.
1. Algorithms Tour
- Warehouse Assignment
- Recommendation Systems
- Matchmaking
- Human Computation
- Logistics Optimization
2. Algorithmic Considerations
algorithm should be designed to
- solve a problem
- efficient
- as simple as possible
- correctly & ethically
- be adapted
- by humans or systems
algorithms should be FAT:
- Fair
- Accountable
- Transparent
20 Text Analysis
- Approaches To: Text Analysis
- Sentiment Analysis
- TF-IDF
- Visualizations - Word Clouds & Networks
- much more!
1. Sentiment analysis
Programmatically infer emotional content of text:
- Break down into a individual or combination of words
-
compare to a sentiment lexicon : dataset containing words classified by their sentiment
- token:
- what you use for analysis
- tokenization takes corpus of text and splits it into tokens
- stop words
- extremely common words such as “the”, “of”, “to”
- are typically removed from analysis
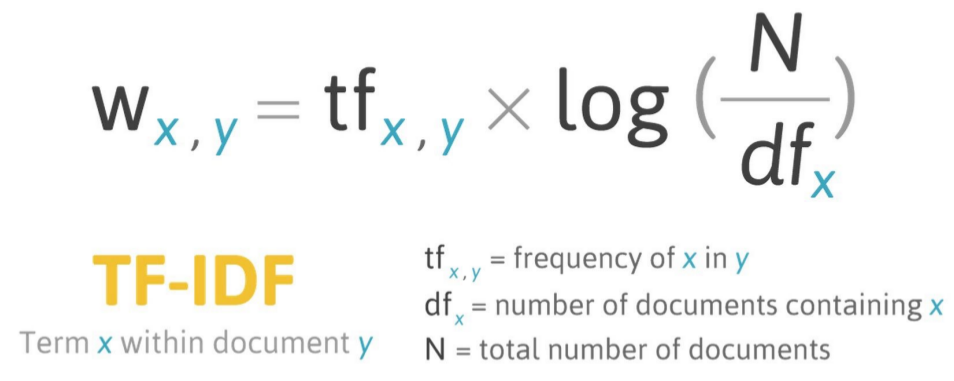
2. TF-IDF(Term Frequency - Inverse Document Frequency)
- Term Frequency (TF) : how frequently a word occurs in a document
- Inverse document frequency (IDF) : intended to measure how important a word is to a document
3. Visualize Narratives - Word Clouds & Networks
21. Geospatial Analysis
1. Why Geospatial Analysis?
- Everything is related to everything else, but near things are more related than distant things
- to examine relationships between geographic features collectively and to use the elationships to describe the real-world phenomena that map features represent
2. Visualizing Geospatial Data
- Use light colors for low values. Dark colors for high values.
- Choropleth Maps shine when displaying a single variable
- Choropleth excel at displaying the big picture, not subtle differences
- Choropleth should display relative differences, not absolute numbers
- Consider using the smallest unit possible(but there are exceptions)
3. Visualization Choices
- Cartograms should be considered when displaying how many people were affected
4. Spatial Statistics
- Violations of conventional statistics:
- Spatial autocorrelation:
-
Modifiable areal unit problem (MAUP):
The aggregation units used are arbitrary with respect to the phenomena under investigation, yet the aggregation units used will affect statistics determined on the basis of data reported in this way.
If the spatial units in a particular study were specified differently, we might observe very different patterns and relationships. - Edge effects (Boundary problem): Analyzing A vs B ignores similarities between the wo based on their shared boundary
- Ecology fallacy: The Ecological Fallacy is a situation that can occur when a researcher or analyst makes an inference about an individual based on aggregate data for a group.(results from aggregated data (e.g. counties) cannot be applied to individual people)
- Nonuniformity of space: Area with high crime rate is because the banks are clustered there.
Guest lecture
1. Getting Your First Job in Data Science
- Persona 1: ● Little to no relevant past job experience. ● No established professional social network in industry. ● Relevant skills acquired through taking college courses.
- The Technical Hustler ● The visibility of technical jobs is democratized in a way that other careers are not. ● It’s possible, easy, and expected to openly share artifacts from your work.
- Persona 2 ● Little to no relevant past job experience. ● Working to establish a professional social network in industry. ● Relevant skills acquired through taking college courses, learning independently, and sharing their learning process.
2. Housecall pro
Useful Iclicker Questions:
1. Common rules
- Requirements for assuring compliance by research institutions
- Requirements for researchers’ obtaining and documenting informed consent
- Requirements for Institutional Review Board (IRB) membership, function, operations, review of research, and record keeping.
- Protections for certain vulnerable research subjects
- pregnant women
- in vitro fertilization and fetuses
- prisoners
- children
2. File name
Which of the following is the BEST file name?
A) 01_beets_yield_report.pdf
B) BeetsYieldReport.pdf
C) beets_yield_report_01.pdf
D) BeetsYieldReport_01.pdf
E) 01_BeetsYieldReport.pdf
choose A)
Reading summary
Reading 2: A Mulching Proposal (Analysing and Improving an Algorithmic System for Turning the Elderly into High-Nutrient Slurry)
1. FAT(Fairness, Accountability and Transparency)
(1) Fair: lacking biases which create unfair and discriminatory outcomes;
(2) Accountable: answerable to the people subject to them;
(3) Transparent: open about how, and why, particular decisions were made;
Reading 3: Tidy data / Data Organization in Spreadsheets
1. why do we need to formalize tidy data?
- Tidy data enable development of tools that all work well together
- Tidy data make analysis easier
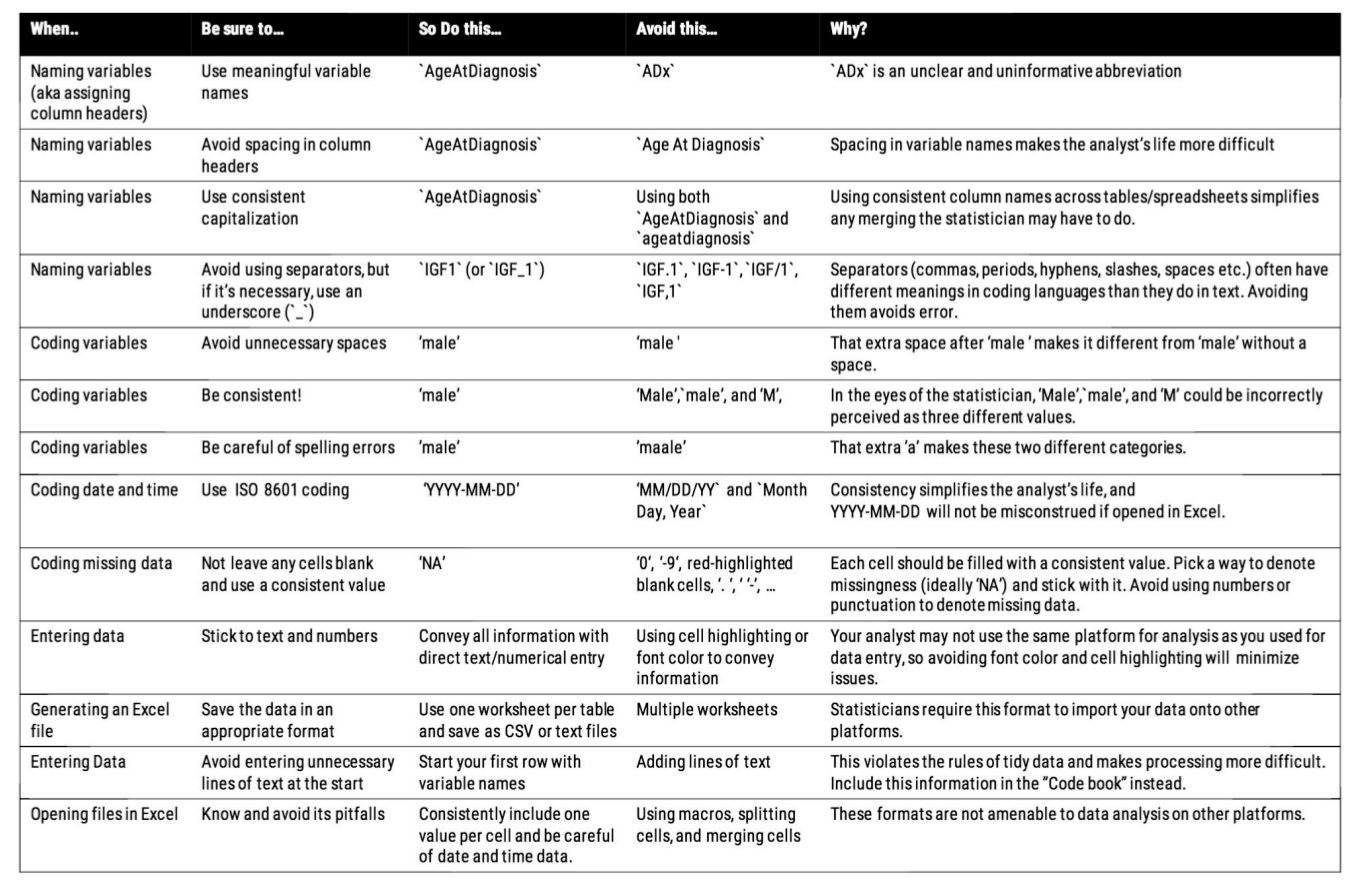
2. Advice Broman and Woo give in Data Organization in Spreadsheets
- Choose short but meaningful variable names
- Use an indicator variable column to avoid cell formatting for emphasis
- Be consistent
- Avoid calculating summary statistics in raw data files
- Enter dates using the global “ISO 8601” standard (YYYY-MM-DD)
Reading 4: Data is Personal: Attitudes and Perceptions of Data Visualization in Rural Pennsylvania
1. Important aspects of visualization literacy
- comprehending visualizations
- reading visualizations
- interpreting visualizations
Reading 5: Machine Bias
Problems in the e2 guideline
Data Visualization
- Which graphs are appropriate for various types of data (i.e. when would you make a histogram? A scatterplot? etc.)
- What are important things to keep in mind when generating visualizations (including graphs a nd tables)?
- When interpreting visualizations, what do you do? (think: look for general pattern and things that are outliers/weird/odd)
- What colors are good to use? Which colors and color combinations to avoid?
- What’s the difference between an exploratory and an explanatory visualization?
- What is the “data to ink ratio” and how does changing that ratio aid in understanding data visualization?
- What does it mean to iteratively improve a visualization?
- What makes a good exploratory visualization? What takes a visualization from exploratory to explanatory?
- What differs between visualizations on paper and those presented using slides?
- What does visualization have to do with storytelling and/or effective communication?
- What experiment was carried out in D ata Is Personal (R3) ? What did the authors learn from this work?
Descriptive Analysis
- What is a descriptive analysis?
- What are the best practices for sampling from a population? - How do we describe a dataset? What measurements do we use? (size, missingness, shape, central tendency, variability)
- What are the differences between the mean and the median? In what situations would you favor one over the other?
Exploratory Data Analysis (EDA)
- What is EDA?Why do EDA?
- What does it mean that EDA is an iterative process?
- What are the general steps in an exploratory analysis?
- What types of plots are helpful during EDA?
- When is EDA helpful? When is it not the right approach?
- What were the main lessons from T idy Data and Organizing Data in Spreadsheeets (R3)?
- How do the lessons learned in Tidy Data and O rganizing Data in Spreadsheeets (R3) help in EDA and analysis?
Inference
- What is inferential analysis? What types of questions are appropriate for inference?
- What does sampling have to do with inference?
- What is Anscombe’s Quartet? What is interesting about Anscombe’s quartet? Note here that these four sets of X,Y pairs have very similar, if not identical, summary statistics: means and variances for both X and Y, the X,Y correlation, as well as the equation for the regression line. Yet they are clearly very different upon cursory visual inspection.
- Why is setting a p -value—the probability of observing a result assuming that the null hypothesis is true—at an arbitrary threshold such as 0.05 (1-in-20) problematic? If you run 20 (independent) tests, you’re likely to get one that results in a “significant” effect!
- What does correlation demonstrate? What does it mean when people say correlation does not equal causation?
- What does a comparison of means demonstrate? What statistical test could you use for this? What assumptions must be met for this statistical test?
- What is regression? What are the assumptions of linear regression?
- What are confounders?
- What was the vertebroplasty example? What did this example demonstrate?
A|B Testing
-
What is A B testing? When is it used? - What considerations are made when designing an experiment?
-
What considerations are made after the A B test has been started? - Why are p-values less informative than confidence intervals?
-
What are subgroups when it comes to A B testing? - What is bucketing skew? What could cause bucketing skew? -
What could cause noise in an A B test? - What does it mean to change one variable at a time?
Machine Learning
- What is Machine Learning (ML)?
- What are the four basic steps to prediction? What does each of them mean?
- What are the differences between supervised and unsupervised learning?
- What are the differences between regression and classification?
- What are decision trees? When would you use them?
- What does it mean to assess machine learning models?
- How are deep learning and machine learning related?
- What is overfitting?
- What does ethics have to do with predictive analyses?
- What is predictive policing and what does it have to do with risk scores and jail sentences? (R5)
Algorithms & Computability
- What is the definition of an algorithm?
- How can the performance of an algorithm be measured?
- At Stitch Fix, at what points in the process are algorithms used?
- What is meant by “What the average user thinks they are doing is what is actually being done?”
- What does it mean for an algorithm to be FAT?
- What was the algorithm proposed in A Mulching Proposal (R2) ? What does this have to do with ethics?
Text Analysis
- What is the “TF” in TF-IDF? What is the “IDF”?
- What is a “token”?
- What is sentiment analysis? What is a lexicon?
- What are some limitations of sentiment analysis?
- What are word clouds?
- How can we analyze text in novels?
- What are a few ways you can deal with the issue of context in text data?
Geospatial Analysis
- What is wrong with plotting raw count histogram-type distributions of many real-world geospatial features, such as population, economic activity, number of website users, etc.?
- How can plotting certain features, such as disease prevalence rates by geographic region, help scientists form new hypotheses about disease causes (or cures)? - What is a choropleth map?
- In what ways do spatial data violate conventional statistics?
- What is spatial autocorrelation, and in what way are many real-world geospatial features highly spatially autocorrelated?
- The modifiable areal unit problem (MAUP) is important for things such as Gerrymandering: how we divide features across space influences aggregate statistics within those subdivisions! Be sure you understand this.
- What is the ecological fallacy?
Vanessa from HouseCall Pro’s Guest Lecture
- Where does Vanessa work?
- What does that company do?
- What is her role at the company?
- Why were “funnels” discussed? What are these funnels?
- Where does data/data science fit in at her company?
- Why did Vanessa emphasize the importance of “domain knowledge”? What does this mean?
Data Science Jobs Lecture
- What were the two personas of people who search for data science jobs?
- What positions would you look for if searching for a data science internship/job?
- What are the barriers to entry for someone searching for a data science job?
- Other than an internship, what can undergraduates do to increase their chances of employment?